Friday, January 29, 2016

Psychology: Physiological psychology: Olfactory (smell) module facial attractiveness

Psychology: Physiological psychology: Olfactory (smell) module facial attractiveness

Authors: Dematte et al. (2007)

Key terms: Smells and facial attractiveness

Background/ Context:
  • Facial attraction is a socially important cue that has been researched in depth.
  • Studies show smell is very important for animals in determining their mate.
  • Therefore, is attractiveness determined by other cues such as olfaction?
  • Olfaction: Sense of smell.
  • This study focuses on female participants because it is said that females are more sensitive to olfactory cues than men, and might rely more on olfactory cues when it comes to mating behaviour.
Aim/ Hypothesis:
  • Discover whether olfactory cues affect people's judgements of attractiveness.
  • Specifically: Whether pleasant odors increase male attractiveness, and whether unpleasant odors decrease male attractiveness.
Method: Laboratory experiment (including minor questionnaire)

Variables:
Independent variables:
  1. Three conditions: Pleasant odors (Geranium and Gravity), Unpleasant odors (Synthetic body odor rubber) and a neutral odor (clean air).
  2. High facial attractiveness, low facial attractiveness.
  • Dependent variable: Ratings of attractiveness from 1 (least attractive) to 9 (most attractive).
Design: Repeated measures and counter-balancing.
  • Counter-balancing so each 40 face was presented with a different odor condition.
  • 3 blocks of experiment sessions with a 5 minute break between each. 2nd and 3rd session replicated the 1st.
  • Each block presented all 40 faces; divided into 4 sets of 10 faces. 
  • Each set of 10 faces were divided into 5 attractive and 5 unattractive.
  • No two odors were presented together.
  1. Set 1: 10 faces with clean air, geranium and body odor.
  2. Set 2: 10 faces with clean air, gravity and rubber.
  3. Set 3: 10 faces with clean air, geranium and rubber.
  4. Set 4: 10 faces with clean air, gravity and body odor.
  • Order of presentation randomized.
  • Whole experiment lasted 50 minutes per participant.
  • 120 trials in total for block 1. Same procedure repeated for a 2nd and 3rd time.
  • Trials were randomized in each block. 
Participants and sampling technique:
  • 16 female students from Oxford University, UK.
  • Aged 20-34.
  • None knew the purpose of study.
  • Completed confidential questionnaire to ensure they all had a normal sense of smell - no olfactory disorders, asthma, no flu. normal or corrected (eg. glasses) vision. This was to make sure no other variables other than odor affected their judgement.
Apparatus:
  • Questionnaire to determine health (eg. olfactory or respiratory) problems.
  • 40 male faces (13 x 17 cm) from a standardized face data base (previously categorized into attractive and unattractive faces).
  • 4 odors: 2 pleasant (geranium and gravity), 2 unpleasant (synthesized body odor and rubber) and control with no odor (clean air). 
  • Olfactometer: Computer controlled machine to deliver odors. 
  • Computer to view the male face images.
Controls;
  • Questionnaire before study to make sure participants can detect smell normally ("Are you currently suffering from a cold/flu?", "Do you suffer from asthma or any air-born allergy?") - to ensure validity and ability to generalize.
  • Presentations of faces and odors were counterbalanced - each face was presented with each odor to remove order effects and increase validity.
  • Presentations of pleasant and unpleasant odors were counterbalanced to also prevent order effects.
  • Presentation time was controlled at 500 milliseconds (Half a second) to increase validity.
  • Time for tone presentation and release of odors was standardized.
  • Odor intensity standardised for each participant because each odor has a different intensity; Odors were diluted to ensure not one smell was more intense than the others: Body odor 0.33%, Geranium 1%, Gravity 0.5% and Rubber 1.2%, which was confirmed during the pilot study.
Procedure:
  1. Participant sat on a chair 70 cm from the computer screen. A chin rest was used to keep their head stable.
  2. Participants were told to look at the cross on the screen.
  3. Participants were told to exhale when they heard a quiet tone.
  4. Participants were told to inhale through their nostrils when they heard the loud tone.
  5. Half a second after participants inhaled the 4 odors or clean air were delivered through the olfactory machine.
  6. A second after the odor had been delivered a face would appear for 500 milliseconds (half a second) - So participants would not have time to analyse and examine the face. When the face disappeared clean air was delivered, cleansing the room of any odor.

Thursday, January 28, 2016

Biology: Chapter 7: Transport in plants: Parts of plants

Biology: Chapter 7: Transport in plants: Parts of plants


Flowering plants (Angiosperms)
  • Cotyledon: First part of seedling to emerge from soil when it germinates.
  • Monocotyledons (Monocot): Plants that have only one cotyledon. Usually have long narrow leaves and flower parts in multiples of 3 eg. grass.
  • Dicotyledons (Dicot): Plants with 2 cotyledons. Usually have leaves with blades and stalks eg. sunflowers. All plants in this chapter are dicotyledons.

Parts of the plant

Cortex: 
  • Outermost layer of root and stem tissue in plants. 
  • Between Epidermis and Endodermis.
  • Composed mostly of parenchyma and specialized cells.
Pith: Central region of stems.

Epidermis: 
  • Outermost layer of whole plant structure.
  • Covers the whole plant.
  • One cell thick. Closely packed, without chloroplasts or space between cells.
Endodermis:
  • Innermost layer of cortex.
  • Surrounds vascular bundle.
  • One cell thick.
  • Controls entry of water and substances into vascular bundle by Casparian strip.
Mesophyll:
  • Leaf cells
  • Specialised parenchyma cells found between lower and upper epidermis of the leaf.
  • Specialised for photosynthesis: contain chloroplasts. 
  • Palisade mesophyll: Column shaped. Near the upper surface of leaf to recieve more sunlight. Contain more chloroplasts than spongy mesophyll.
  • Spongy mesophyll: Irregular sponge shapes. Underneath palisade cells. Have many large air spaces between the cells to let gas from the stomata diffuse around cells.
Parenchyma:
  • Thin walled cells.
  • Living at maturity,
  • Used as packing tissue.
  • Metabolically active - many functions.
  • Can specialize. 
  • For example: Storage of starch. When turgid, help support plant and prevent wilting. Air spaces between these cells allow gas exchange. Water and mineral salts transported through walls and living contents of cell. 
  • Contain chloroplasts in leaves - specializes to become palisade and spongy mesophyll tissue.
  • Form cortex in roots and stems.
  • Form pith in stems.
Collenchyma:
  • Modified form of parenchyma with extra cellulose deposited at ends of cells, providing extra strength.
  • Living at maturity.
  • Midrib of leaves contains collenchyma.
Sclerenchyma:
  • Thick secondary cell walls.
  • Contain lignin for extra strength.
  • Lignin: With cellulose, main component of wood. Water proof and strong.
  • Dead at maturity.
  • Cannot increase in length.
  • Found anywhere in plant.
  • Provide support in plants.
Pericycle:
  • One to several cells thick.
  • Between the endodermis and vascular bundle.
  • In roots, is one cell thick, and new roots can grow from this layer by meristematic cells.
  • Meristematic cells: Plant stem cells.
  • In leaves, formed by sclerenchyma cells, which is dead and lignified for extra strength.
Stele: Contains vascular bundle in roots and stems.

Vascular tissue:
  • Contain the types of xylem and phloem systems.
  • Tubes for transportation of fluids.
  • Xylem and phloem found in vascular bundles.
  • Outsides made of sclerenchyma fibres which provide exta support.
Xylem:
  • Long distance transport of water and mineral salts. 
  • Xylem vessel elements: Tubes made of dead cells. Reinforced with lignin. 
  • Dead at functional maturity.
Phloem:
  • Long distance transport of organic compounds eg. Sucrose.
  • Living cells.
  • Have a companion cell alongside the tube.
  • Contain tubes called sieve tubes 
  • Sieve tube elements: Living cells that make up the sieve tubes.


Monday, January 25, 2016

Psychology: Physiological psychology: Taxi drivers brain activity

Psychology: Physiological psychology: Taxi drivers brain activity

Authors: Maguire et al. (1997)

Key term: Taxi drivers

Background/ Context: The invention of technology such as PET and MRI scanners has led to many studies on brain regions and activity. Topographical memory is the knowledge of landscapes and the spatial relationship between them - a cognitive (mental) map we have inside our heads. Maguire's study is on semantic topographical memory and what brain regions are responsible for it.
PET: Positron Emission Tomography.
Semantic memory: General world knowledge we have

Aim/ Hypothesis;

  1. Confirm findings of other studies that specific brain regions are responsible for semantic topographical memory retrieval
  2. Determine which specific region of the brain is responsible for landmark knowledge when location information is not needed (topographical memory without sequencing).
  3. Study topographical and non-topographical semantic memory to see if there is brain region that is activated for both
Method: Laboratory experiment with pre-study questionnaire
  • Participants filled out a questionnaire asking them about:
    -Areas of London they were familiar with.
    -Films they were familiar with from a list of 150 films from 1939 to the present day.
    -20 world famous landmarks participants could visualize but had never visited.
  • This would let experimenters choose the most appropriate routes, landmarks and films they wanted the participants to describe.
  • Pilot study done with non-participating taxi drivers before this experiment to make sure the tasks and equipment were fit for the study.
Variables:
Independent variables
  • Main variables: Topographical and Sequencing.
  • The participants completed 6 tasks, each done twice. However only 5 of those tasks are used in this study.
  1. Baseline task - Repeat two sets of 4 digit numbers (to compare simple level of activity to the 4 other tasks).
  2. Describe the shortest route from one point to another in the City of London (same route for all participants, one they were familiar with) (topographical and sequencing).
  3. Describe a landmark in terms of features, appearance, etc (Same landmark for all participants, one they all knew) (topographical and non-sequencing).
  4. Describe the plot of a famous film between two given points of the film. (familiar to all participants) (non-topographical and sequencing).
  5. Describe individual frames of some famous films eg. imagery, characters, etc. (familiar to all participants) (non-topographical and non-sequencing). 
Dependent variable: Region/s of brain activated.

Design: Repeated measures - Factorial design
  • Orders of tasks randomized for each participant and counterbalanced against each other.
Participants and sampling technique:
  • 11 right handed male taxi drivers.
  • Minimum of 3 years experience driving, average was 12.5 years.
  • Average age 45 years.
Apparatus:
  • London route from Grosvenor Square to the elephant and castle.
  • World famous landmarks
  • Films with still frames
  • Siemens PET scanner
  • H2 15 O bolus (radioactive isotope for scanning) and saline flush to remove isotope from body.
Controls:
  • Landmarks chosen were places participants never visited in person, so they were not sequential memories.
  • Films chosen had been watched by participants at least 5 times, so they were all familiar with them.
  • Scanner procedure and injections given were the same for each participant.
  • Pilot study done to ensure all tasks are fit for purpose.
Procedure:

  1. Participant filled out pre-study questionnaire.
  2. Participant arrived at the laboratory and cannula (tube for delivering fluid) was inserted in his arm. Participant was blindfolded and placed in scanner.
  3. Participant received H2 15O bolus injection through cannula (which takes 20 seconds to enter bloodstream). This was followed by a saline flush (which also takes 20 seconds). 
  4. Scan frame time was 90 seconds (H2 15O has a half life of 2 minutes). 1 of the 5 tasks was presented and the participant had to give a description of the route, landmark, film plot or frame, which was digitally recorded. MRI was also taken for each taxi driver,
  5. After the task was completed their would be an 8 minute wait before another task was done.
  6. Steps 3, 4 and 5 repeated 12 times (2 times for each study including another task for another study not in this paper). 
  7. Participant was debriefed and study was complete.
Data: Quantitative data - rCBF (Regional cerebral blood flow) would flow to areas of brain activated, which would be recorded by the PET scanner, interpreted and analysed. 3D images of the PET scanner show exactly which brain region is involved in each process.

Findings:
  • No difference in amount of speech per participant (around 50 seconds).
  • Very few differences in route chosen by participants.
  1. Routes (T+ S+): Right hippocampus, parahippocampal gyrus, cerebellum, media parietal lobe, posterior cingulate cortex, extrastriate regions.
  2. Landmarks (T+ S-): Parahippocampal gyrus, posterior cingulated cortex, medial parietal lobe, occipito-temporal region, cerebellum.
  3. Films (plot and frames - T- S+ and T- S-): Left frontal region, cerebellum, middle temporal gyrus, left angular gyrus.
  • Cerebellum activated in all activities
  • The parahippocampal gyrus and medial parietal lobe were used for both topographical activities. However, the right hippocampus was only activated in the route activity - topographical and sequencing.
Conclusion:
  • Regions of topographical semantic memory similar as those in previous studies.
  • Right hippocampus used for sequential route planning.
Strengths:
  • Laboratory experiment - High level of control - pilot questionnaire, routes, landmarks and films chosen - easily replicated to test for reliability.
  • Laboratory experiment - High level of control - confidence the type of tasks directly affected brain function - IV directly affects DV - baseline task, type of tasks.
  • Technological equipment - lack of human error 
  • Testing physiological aspects (brain function) - can be generalized to wider population, as majority of humans have similar brain structures.
Weaknesses:
  • Laboratory experiment - Artificial setting - Participants were tested whilst undergoing a PET scan, which is not a normal setting for recalling memory, therefore this experiment may not have ecological validity
  • Laboratory experiment - Lacks mundane realism - Participants were blindfolded and asked to recall memories during a PET scan, which is not a normal task people do in daily life.
  • Can't be generalized - Participants were all taxi drivers - It is possible the right hippocampus in sequential topographical memories is only crucial in taxi drivers.

Wednesday, January 20, 2016

Biology: Chapter 6: Nucleic acids and protein synthesis: Protein synthesis

Biology: Chapter 6: Nucleic acids and protein synthesis: Protein synthesis

  • Protein synthesis: Process in which the bases on the DNA molecule is used to code for the sequence of amino acids in a polypeptide.
  • Sequence of amino acids determine the 3-D folding of the protein and therefore it's function.

Transcription

  • A section of the DNA (gene) has the instructions for creating a mRNA (messenger RNA) molecule.
  • Promotor: Signals the start of a gene.
  • Terminator/ Stop sequence: Signals the end of the gene.
  • RNA polymerase: Binds to the promotor and when the DNA uwinds initiates RNA synthesis.
  • Sense strand: DNA strand with the same code as the mRNA.
  • RNA polymerase starts RNA synthesis as the DNA unwinds at the promotor. 
  • Moves down the DNA strand in a 5' to 3' direction, until it reaches the base code for the stop sequence at the end of the gene, where the newly formed RNA transcript peels off the template strand.
  • DNA rewinds back into the double helix after the RNA synthesis.
  • The mRNA breaks away from the DNA and leaves the nucleus through the nuclear pores into the cytoplasm.
  • mRNA (messenger RNA): RNA transcript created in translation.
  • Template strand: DNA strand that the mRNA uses as a template for RNA synthesis - the antisense strand.
Simple diagram of transcription.

Translation

  • Process of building chain of amino acids following code on mRNA molecule made in transcription.
  • mRNA leaves nucleus through nuclear pores into the cytoplasm.
  • Ribosome (made of rRNA - ribosomal RNA) clamps around the mRNA.
  • Ribosomes: Responsible for protein synthesis.
    Have 2 units - large subunit and small subunit, which clamp around the mRNA.
    The large subunit has 3 sites - A siteP site and E (exit) site.
    These are for tRNA (transfer RNA) to come in and bond to it's complementary codon.
    Two tRNA molecules can be in a ribosome at one time.
    Ribosome.
  • Codon: Groups of 3 bases which code for an amino acid
  • Anti-codon: 3 bases on a tRNA. Forms a bond with it's complementary codon on the mRNA strand in the ribosome.
  • tRNA (transfer RNA): Made from a single strand of RNA, twisted to form a 3 leaf clover shape. Has a anti-codon (base triplet) on one end, and amino acid attachment site on the other.
    tRNA molecule.
  • The tRNA bonds to an amino acid specific to it's anticodon and carry it to the ribosome, where it forms hydrogen bonds with it's complementary codon on the mRNA strand.
  • 2 tRNA molecules are in the ribosome at one time. The ribosome cuts the bonds of the amino acid and the tRNA in the P site, and the amino acid forms a peptide bond with the amino acid on the tRNA in the A site, forming a amino acid chain.
  • The ribosome then moves down the mRNA chain, in a 5' to 3' direction. 
  • The tRNA that was previously in the P site moves to the E site, and is released from the ribosome. 
  • The tRNA in A is now in P, and a new tRNA enters the A site
  • The ribosome again cuts the bond between the amino acids and tRNA in the P site, which again form a peptide bond with the amino acid on the tRNA in the A site
  • The process continues, forming a polypeptide chain.
    Ribosome in translation.
  • start codon signals the start of translation in the ribosome - usually AUG
  • When the stop codon is reached on the mRNA strand - usually UAG, UAA or UGA, the ribosome accepts a release factor, which allows the ribosome to break the bond between the last tRNA and it's now polypeptide chainreleasing the polypeptide chain, which will fold into secondary, tertiary and quaternary structures according to it's amino acid sequence.
  • The ribosome and tRNA seperate from the mRNA chain.
  • There are 20 different types of amino acids present in the cytoplasm.
  • Many ribosomes work on the mRNA strand at one time, so multipe copies of the polypeptide can be made efficiently.
    Translation diagram.
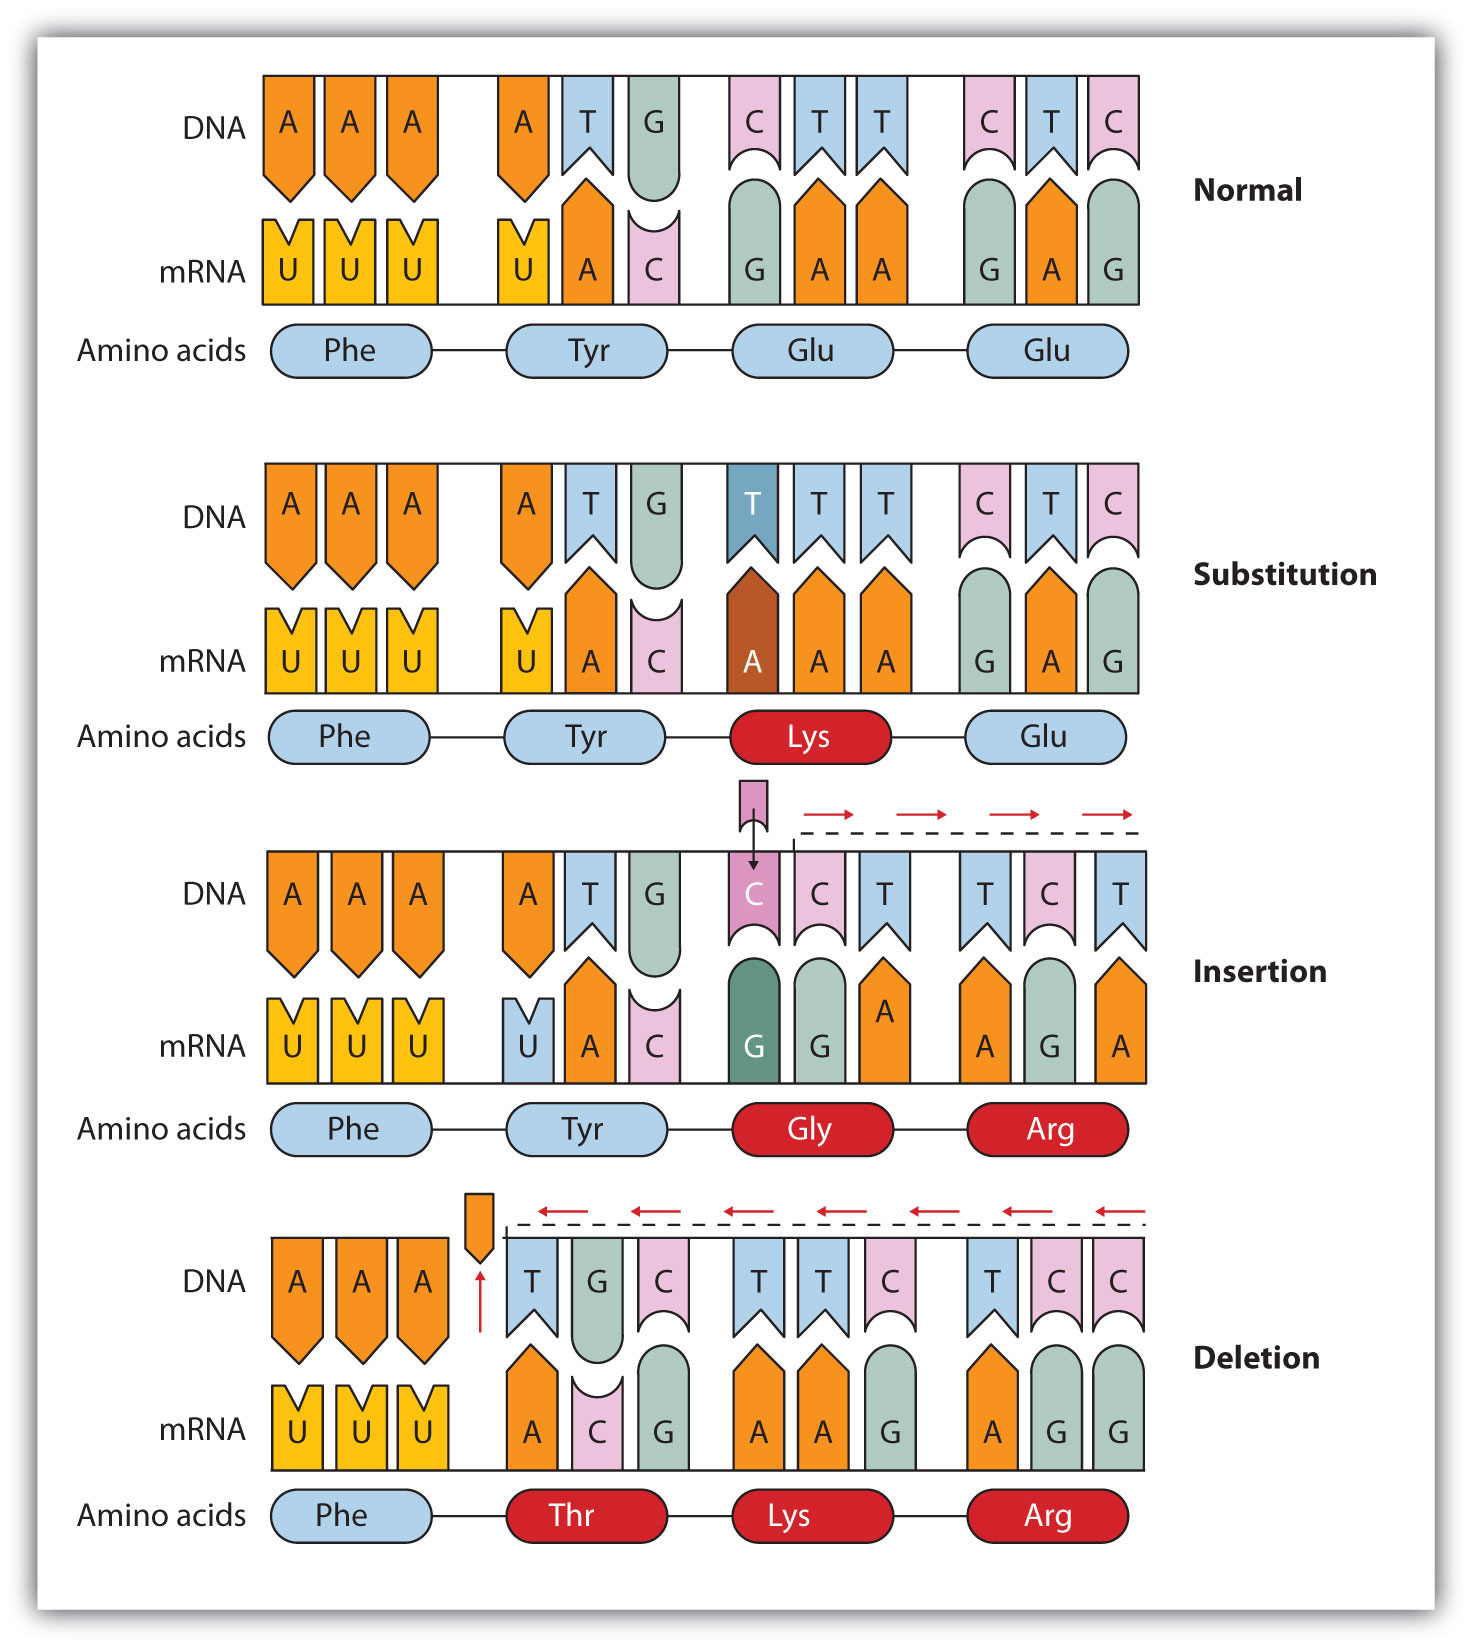
Mutations

  • Changes in the genetic material.
  • Change of bases in the code, which can lead to a new gene (alleles).
  • Alleles: Different types of the same gene (Blue or brown eyes).
Point mutations - Changes in just one base pair
  • Substitution: Replacement of one nucleotide and it's complementary base in the DNA strand. Leads to alteration in amino acid sequence, which can hinder protein function eg. Sickle cell anemia - glutamic acid replaced with valine.
  • Insertion/Deletion: nucleotide pair inserted or removed in the DNA strand. Can result in an extra or missing amino acid. May alter reading frame (codon groups) - Frameshift mutation, which creates a protein that is almost certainly unable to function.
DNA mutations.

Monday, January 18, 2016

Biology: Chapter 6: DNA and Nucleic acids: DNA replication

Biology: Chapter 6: DNA and Nucleic acids: DNA replication

  • In 1953, James and Watson Crick used the results of work by Rosalin Franklin to develop a model of the structure of DNA.
  • Semi-conservative replication: Method of copying where half of the original molecules are kept (conserved) in the new molecules.
    Simple diagram of semi-conservative replication in DNA.
  • Enzyme Helicase unzips parental double helix, separating the two strands.
  • Replication fork: Where the DNA strands are separating.
    Replication fork.
  • Single-strand binding proteins: Keep the two parental strands separated by temporarily hydrogen bonding to the bases.
  • Primase: Adds RNA primer to DNA strand
  • RNA primer: Initiate DNA synthesis by DNA polymerase
  • DNA polymerase: Builds a new strand by assembling the nucleotides to the parental strand. Nucleotide bases form the specific bonds with its complementary base on the parental strand, therefore it is almost impossible to make a mistake. Only works in a 5' to 3' direction.
  • Since DNA polymerase can only work from a 5' to 3' direction, one strand can be built continuously as the replication fork progresses. 
  • Leading strand: Strand that is built continuously from from 5' to 3'.
  • However, one strand will have the replication fork progressing towards 5'. This strand will grow in the overall direction of 5' to 3' by the addition of short fragments as the replication fork progresses. 
  • Lagging strand: 3' to 5' strand that needs to be built in fragments.
  • Okazaki fragments: Fragments used to build the 3' to 5' strand.
  • Another DNA polymerase replaces RNA primer with DNA.
  • DNA ligase: Joins okazaki fragments together to growing strand.
DNA replication diagram.

Proofreading DNA
  • DNA polymerase proofreads each nucleotide and removes incorrectly paired nucleotides.
Repairing DNA
  • DNA molecules that are exposed to harmful chemical and physical agents eg. Tobacco, UV rays can change nucleotides, which can affect encoded genetic information. However, the DNA has some ways of fixing it.
Nucleotide excision repair:
  • Nuclease enzyme: Cuts damaged DNA strand at it's 2 points.
  • Repair synthesis by DNA polymerase fills gap
  • DNA ligase: Seals the phosphate sugar backbone together.

Friday, January 15, 2016

Biology: Chapter 6: Nucleic acids and protein synthesis: DNA and RNA structure

Biology: Chapter 6: Nucleic acids and protein synthesis: DNA and RNA structure

Nucleotides aka Nucleic acids

  • Smaller molecules that DNA and RNA are made up of.
  • Polynucleotides: Long chains of nucleotides eg. DNA and RNA.
  • Composed of 3 components:
    -Pentose sugar
    -Nitrogen-containing base
    -Phosphate group
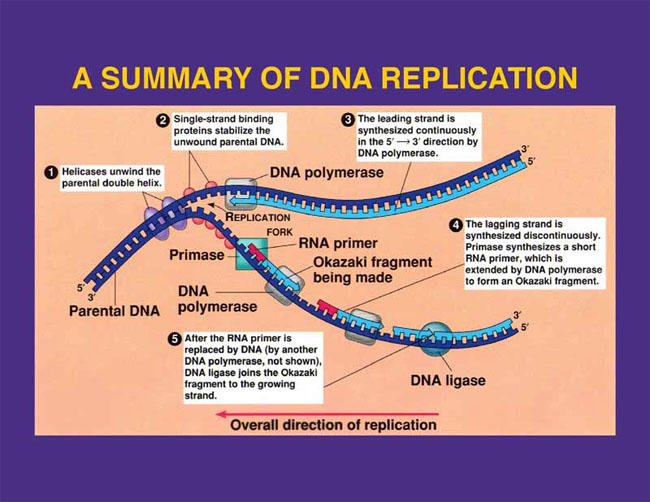
Structure of nucleotide.
  • Pentose sugar: Sugar with 5 carbons. Can be either Ribose (in RNA) or Deoxyribose (in DNA.
  • Deoxyribose: Missing an oxygen on it's second carbon primer.
Nitrogen-containing bases aka Nitrogenous bases
  • Purine bases: Double ring structure - Adenine, Guanine.
  • Pyrimidine bases: Single ring structure - Thymine, Cytosine, Uracil.
  • DNA contains the 4 bases A-T and C-G, but never Uracil.
  • RNA contains the 4 bases A-U and C-G, but no Thymine.
Structural formulae of the nitrogenous bases.

ATP: Similar structure to a nucleotide. Adenosine (Ribose sugar with the base Adenine) can be combined  to 1,2 or 3 phosphates to make Adenosine Monophosphate (AMP), Adenosine Diphosphate (ADP) or Adenosine Triphosphate (ATP).

Polynucleotides
  • Polynucleotide: Many nucleotides linked together in a chain
  • Formed during interphase of the cell cycle.
  • Sugar-phosphate backbone: Alternating sugars and phosphates of the nucleotides linked together with the bases projecting sideways.
  • Phosphodiester bonds: Covalent sugar-phosphate bonds.
  • Phosphodiester bonds link the Carbon 5 of one sugar to the Carbon 3 of the next.
  • The polynucleotide is said to have 3' and 5' ends: the end where the Carbon 3 has nothing to link is called the 3' end, while the end where the Carbon 5 has nothing to link to is called the 5' end.
  • Bases can be purines or pyrimidines: Purines only link with pyrimidines, but it is even more precise.
  • In a DNA molecule, there is only enough room between the two sugar-phosphate backbones for 1 purine and 1 pyrimidine molecule, so a pyrimidine can only bond with a purine, since purines are larger.
  • Adenine and Thymine form double hydrogen bonds, whereas Guanine and Cytosine form a triple hydrogen bond, therefore only pairs possible are A-T and C-G.
  • Complementary base pairing: The precise pairing of bases due to hydrogen bond and structure size (purine/pyrimidine) : Adenine and Thymine (A-T), and Cytosine and Guanine (C-G).
Animation of DNA replication and the DNA strand.
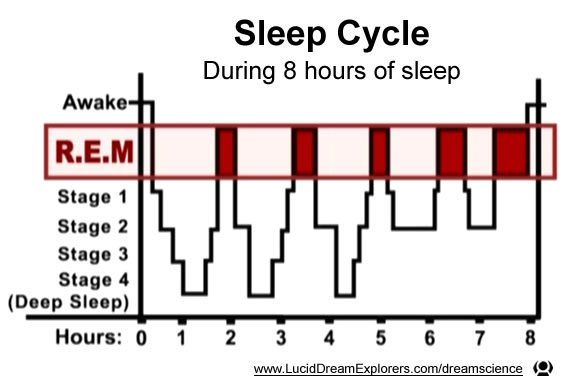
  • Double helix: Two strands wrapping around each other - the 3D shape DNA molecules form.
  • Hydrogen bonds linking the bases easily broken, which happens during DNA replication and protein synthesis. 
  • RNA molecules are only single stranded.


Sunday, January 10, 2016

Psychology: Physiological Psychology: Relation of eye movements in sleep to dream activity

Psychology: Physiological Psychology: Relation of eye movements in sleep to dream activity

Author: Dement and Kleitman (1957)

Key terms: Sleep and dreaming

Background/Context:
  • Scientific studies of sleep and dreaming increased after the invention of physiological techniques to measure brain activity which could indicate dreaming (EEG - Electro-encephalograph) and electrical recording of eye movement (EOG - Electro-oculogram).
  • In 1953 Aserinsky identified REM (rapid eye movement) and NREM (non-rapid eye movement). There are 4 stages of NREM, with 1 being the lightest and 4 the deepest
  • When we sleep, we alternate between REM and NREM sleep
  • Previous studies show that people woken from REM sleep were more likely to report having a vivid dream than those in NREM. 
  • This shows dreams most likely occur in REM sleep
  • REM is similar to being awake as our brains are most active, and our eyes move behind their eyelids. However we are difficult to wake up during REM sleep and the brain releases signals to keep our muscles paralyzed so we do not move while dreaming.
  • EEG (electro-encephalograph) detects and records tiny electrical changes associated with nerve and muscle activity, producing a chart that shows brain waves, which change with frequency and amplitude. 
  • Brain waves during REM sleep are low voltage, high amplitude, whereas in NREM sleep they're high voltage and low amplitude.
  • Nowadays EEGs are computerized, but in this study the graphs were drawn on continuous running paper. The faster the paper moved, the more detail could be recorded. Paper usually moved at 3mm - 6mm per second
  • Same electrodes used for the EEG can be used to record eye movements when placed near the eyes. The output is called a EOG (electro-oculagram), which indicates the presence or absence of eye movements, the size and their direction
PictureSleep cycle graph
Aim/hypothesis:
  1. Does dreaming occur in REM or NREM sleep?
  2. Can participants accurately estimate the length of time they've been dreaming?
  3. Do eye movement patterns match dream content?
    Sub-question:
  4. Does duration of REM sleep correlate with number of words (description/narrative) in a reported dream?
Method:
  • Aim 1, 3 and the sub-question (4) were naturalistic observations because REM and NREM sleep occurs naturally
  • Aim 2 was a laboratory experiment because participants were woken up to see if they can estimate the time they were dreaming.
Variables:
  • Aim 1: IV: REM and NREM sleep. DV: No. of dreams recalled in each state.
  • Aim 2: IV: Woken after 5 minutes and woken after 15 minutes. DV: No. of correct dream length estimations
  • Aim 3: IV: Direction of eye movement. DV: Description of dream (or no dream) when woken.
  • Aim 4 (sub-question): DV: Total number of words used to describe a dream correlating with length of dream. 
Design: Repeated measures - All participants slept and woken up at various times.

Participants and sampling technique: 
  • 9 adult participants in total: 7 male, 2 female.
  • 5 main participants studied in detail
  • 4 participants used to confirm data from main 5.
  • Main 5 spent 6-17 nights in laboratory and were tested with 50-77 awakenings.
  • 4 others spent 1-2 nights in laboratory and tested with 4-10 awakenings.
  • Each patient identified with their initials.
Apparatus:
  • Bed
  • Electrodes connected to EEG
  • Door bell
  • Tape recorder
Controls:
  • All participants asked not to drink alcohol (depressant) or caffeine (stimulant).
  • All participants woken with a bell.
  • All participants recorded their dream into a tape recorder.
Procedure:
  1. During daytime participants ate normally, but didn't drink caffeine or alcohol.
  2. Participants arrived at the laboratory before normal bedtime and were fitted with electrodes on the scalp (to record brain waves) and near the eyes (to record eye movements). 
  3. They then went to a quiet, dark room and wires from the electrodes were gathered into a 'pony tail' from the person's head so they can move freely.
  4. EEG and EOG would run continuously through the night to monitor participant's sleep stages and inform the experimenters when to wake the participant.
  5. Participants were woken with a doorbell, so experimenters did not have to enter the room, therefore participants were all treated the same way.
  6. Door bell would ring at various times during the night and when participants woke up they would say whether or not they had a dream, and if they did, they would describe their dream into a voice recorder. Descriptions were only considered a dream if it was a understandable, fairly detailed description. 
Participants had different conditions of REM and NREM wakenings, which were chosen by the experimenter:
  • PM and KC were woken randomly to prevent possibility of unintentional pattern.
  • WD also woken randomly, but told he would only be woken from dream (REM) sleep.
  • DN woken in repeating pattern of 3 REM sleeps then 3 NREM sleeps.
  • Waking of IR chosen by the experimenter.
Data:
  • Quantitative: Instances of dream recall in each stage, dream length estimation and no. of words in dream description.
  • Qualitative: Descriptions of dream.
Results
Aim 1: Dream recall in REM and NREM sleepResults from Aim 1's study
  • Participants described dreams more often when woken from REM sleep and hardly in NREM sleep. 
  • This was accurate for every participant
  • WD's recalls were no less accurate despite being misled.
  • DN was no more accurate even though he might have guessed the pattern of wakings.
  • Recall of dreams during NREM sleep was much more likely if participant was awoken soon after end of REM sleep.
  • Participants woken in NREM sleep described feelings such as anxiety or pleasantness but not specific dream content.
Aim 2: Estimation of dream length
  • Asking participants to guess their dream time was too difficult, so instead they were asked whether they had been dreaming for 5 or 15 minutes, in which participants would respond more accurately.
  • For participants who dreamt for 15 minutes, participants guessed right 88% of the time.
  • For participants who dreamt for 5 minutes, participants guessed right 78% of the time.
  • Only DN consistently underestimated dream length because he could only remember the end of his dream, making his 5 minute dream estimates accurate but not 15.
Aim 4 (sub-question - length of dream description correlating to duration of REM sleep):
  • 152 dream narratives collected, but only 146 were able to be accurately transcripted
  • 15-35 dreams per participant.
  • Significant correlation between REM sleep and number of words, although affected by how expressive participant was.
  • Dream descriptions for longer REM sleep were not much longer than dream descriptions for 15 minutes.
Aim 3: Eye movement patterns and dream content
  • Participants were woken after 1 minute of continuous specific eye movement (vertical, horizontal, both of little movement).
  • 3 out of 9 participants who had frequent vertical eye movements reported dreams about vertical movement.
  • One participant dreamed about standing under a cliff, looking at various climbers on the cliff and down at his hoist machine. 
  • A participant who showed horizontal eye movement had a dream about people throwing tomatoes at each other.
  • The 10 times participants were woken after little or no eye movement reported having dreams of watching something in the distance or staring at a fixed object.
  • In 2 cases participants had dreams about driving.
  • The 21 wakings after mixed eye movement participants reported having dreams about looking at things or people nearby (instead of far away) eg. Fighting or talking to a group.
  • Dement and Klietman also recorded participants eye movement when awake and discovered their waking eye movements when looking at nearby objects were similar to when dreaming of looking at nearby objects. 
Conclusions:
Aim 1: Vivid, visual dreams reported only from waking during or shortly after REM sleep. REM sleep is longer later in the night so dreaming is more likely at this time.
Aim 2: Dreams are not instantaneous events but actually happen in 'real time'.
Aim 4 (sub-question): The longer the duration of REM sleep, the more words are in the dream description.
Aim 3: Eye movements during REM sleep correlate to where and what the dreamer is looking at. Therefore eye movements are directly related to dream imagery and are similar to when we are awake.

Strengths:
  • Laboratory experiment - High levels of control - No caffeine or alcohol, doorbell sound, EEG monitoring, different set waking for each participant - Easy to replicate to test for validity.
  • Laboratory experiment - High levels of control - Easy to conclude IV directly affects DV (dream recall affected by stage of sleep).
  • Physiological psychology - Most people are the same physiologically - Can be generalized to an extent.
Weaknesses:
  • Laboratory experiment - Lacks mundane realism - Being woken multiple times and asked to verbally record your dream with electrodes on your head is not what usually happens in real life.
  • Laboratory experiment - Lacks ecological validity - Sleeping in a laboratory with electrodes on your head is unnatural, therefore results can be invalid since they can be different in real life.
  • Generalization - Only 5 participants were studied in detail, therefore the study cannot be generalized to the wider population.
  • Reductionism - Findings based around biological reasons for dreams - Does not take into account psychological reasons that could affect dream content.

Friday, January 8, 2016

Psychology: Physiological psychology: Cognitive, social and physiological determinants of emotional state

Psychology: Physiological psychology: Cognitive, social and physiological determinants of emotional state

Author: Schachter and Singer (1962)

Key term: Emotion

Background/context: 
  • Earlier theories suggested that emotion was only based on physiological factors.
    Picture
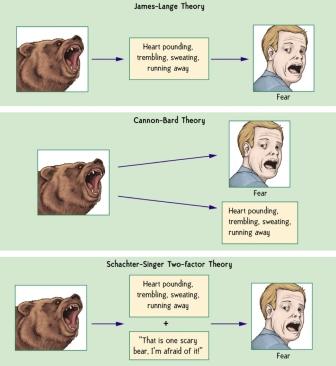
Different theories of emotion.
  • Two factor theory (cognitive labeling theory): Schachter believed that emotion is a result of both physiological and psychological (cognitive) components. This involves the individual giving reasoning to their physiological arousing and labelling it as a certain emotion.
Aim/Hypothesis: To test these 3 propositions:
  1. When someone experiences a state of physiological arousal with no immediate explanation, they will label it depending on the physical cognitions available. So the same state of arousal (eg. Increased heartbeat) could receive different labels (eg. Joy/anger) depending on the physical aspects of the situation (eg. a scary animal or your boyfriend)
  2. If someone experiences a state of physiological arousal for which they have an explanation for, they will label it appropriately and not be affected by other physical factors.
  3. In the same circumstances, someone will describe their feelings as emotions, but only to the extent that they feel a state of physiological arousal.
Method: Laboratory experiment with observation and self-report.

Variables: 
Independent variables:
All participants were told they were being tested for the effect of Suproxin on vision, but Suproxin is a fictional made up drug and they were actually being injected with Epinephrine.
Epinephrine is a drug which almost always perfectly mimics stimulation of the sympathetic nervous system: increase in blood pressure, slight increase in heart rate,  slight increase in respiration. Major symptoms are palpitations, tremors and sometimes a flushed feeling. These effects usually begin 3-5 minutes after the injection and last for 15-20 minutes.
  1. EPI INF (Epinephrine informed): Injected with epinephrine and told the real side effects (palpitations, tremors, warm feeling). Information was reinforced by a doctor.
  2. EPI IGN (Epinephrine ignored): Injected with epinephrine and experimenter said nothing about side effects. Doctor said the injection was mild and harmless and would have no side effects.
  3. EPI MIS (Epinephrine misinformed): Injected with epinephrine and told they would feel side effects from the Suproxin such as feet feeling numb, itchiness and a slight headache, that would last 15-20 minutes. None of these are the actual symptoms.
  4. Placebo (control): Injected with Saline solution (salt solution) which have no side effects and were not told anything
Explanatory cognitions:
  1. Euphoria: Immediately after injection experimenter left and the doctor returned with a stooge (actor), who he said was another participant. They were brought to a room and told they had to wait 20 minutes while the Suproxin kicked in, and the doctor apologized for the messy room. The stooge began acting according to a script consisting of 15 behaviors such as making paper airplanes, playing with the hula hoop, initiating a basketball game, etc).
  2. Anger: Began the same way as the euphoric condition, but the participant and stooge were asked to spend the 20 minutes filling out a questionnaire. Before starting, stooge would state it was unfair to not be told about the injection beforehand. The 5 page questionnaire starts of innocent but grows more and more intrusive and personal. The stooge makes standardized comments about the questionnaire, becoming more argumentative and angry. Eventually, when he gets to the question asking about frequency of sexual intercourse, he rips up his paper and storms out the room.
Participants in EPI INF, EPI IGN and the placebo all experimented one of the two euphoric or anger conditions. EPI MIS participants only experienced the anger conditions, making 7 conditions
Participants were randomly allocated to 1 of the 7 conditions.

Dependent variable: Participants emotional state
  • Observation through a one way mirror during the experiment - eg. Would participant join in the euphoric stooge's games?
  • Self-report on various measures after the experiment before the debriefing - eg. Questions such as "How irritated would you say feel at the present?"
Design; Independent groups - If a participant was to repeat any condition they would know the real aim of the experiment and respond falsely.

Participants and sampling technique: 184 males from the University of Minnesota. All had volunteered to be in a subject pool. They received 2 extra points in the final exam for every hour they took part in the experiment. All participants were cleared by the student health service to make sure the injection would not be harmful to them. 1 participant refused the injection,  11 participants had been very suspicious after the experiment and in 5 participants the epinephrine had no effect at all. So only 167 participants data was used for the findings.

Apparatus:
  • Private room with a one way mirror 
  • 'Suproxin' ie. epinephrine (adrenaline)
  • Placebo ie. Saline solution
  • Euphoria condition: paper, rubber bands, hula hoop, waste paper basket
  • Anger condition: Questionnaire with intrusive questions
Controls:
  • All participants given an injection
  • All participants in each condition followed the same procedure
  • The stooge repeated the same behaviour for each condition, saying and doing the same things at the same time, following a standardized script.
  • Observations were conducted by two observers (inter-rater agreement was high).
Procedure:
  1. Each participant was taken to the private room and given an injection of either epinephrine or saline solution .They were told they were injected with suproxin to test vision
  2. If participant agreed, a doctor would come into the room and administer the injection. 
  3. Participants given 1 of 3 sets of instructions depending on their allocated condition: EPI INF, EPI MIS or EPI IGN/placebo. 
  4. Participant was then taken to another room and told to wait with another participant (actually a stooge) and told to wait for 20 minutes while the suproxin was absorbed into their bloodstream.
  5. The stooge would act accordingly depending on the condition: euphoric or angry. 
  6. Experimenter enters room and hands out questionnaire for 'feedback on effect of suproxin' (self report).
  7. Experimenter debriefs participants (11 of the participants data was discarded because participants admitted they were very suspicious of the experiment). 
Data: Quantitative data was collected
  • Observation: Objective data collected through one-way mirror by two observers, coded into categories. 
  • 4 euphoria categories: joins in activity, initiates new activity, ignores stooge and watches stooge.
  • 6 anger categories: agrees, disagrees, neutral, initiates agreement/disagreement, watches, ignores.
  • Self-report of the participants emotional state on a 5 point scale. 0 meaning they did not feel that emotion and 5 meaning they extremely felt that emotion. Eg. "On a scale of 0-5, how irritated are you right now?"
  • Two questions on the participant's physiological state from a scale of 0-4 eg. "Did you feel any tremors?".
Findings:
  • Physiological response: Participants in the EPI condition experienced more physiological arousal than those in the placebo. The difference was significant.
  • Euphoria self-report: Participants in the EPI MIS and EPI IGN rated themselves more euphoric than EPI INF.
  • Euphoria observations: Same results as the self-report. EPI MIS had the most euphoric activity (22.56) and EPI INF had the lowest (12.72).
  • Anger observations: EPI IGN had the highest anger score of 2.28. EPI INF had the lowest at -0.18.
Conclusion:
For someone to feel a certain emotion, a cognitive (situational) factor is needed along with the physical arousal. The two factor theory was proven to be accurate.

Strengths:
  • Laboratory experiment - Many controls (eg. Stooge's standardized script and activities, what the experimenter said during the injection, what was injected, how behaviours were categorized) - Easy to replicate to test for reliability.
  • Laboratory experiment - Many controls - Confidence that the stimuli provided to participants directly affected their emotion.
Weaknesses:
  • All male students - cannot be generalized, females have different body chemistry therefore may feel emotions differently. Older people may also feel emotions differently, as with people from different cultures.
  • Participants in placebo condition had a higher euphoric and anger condition than that of EPI INF, which is not in line with the theory. This may be because the injection itself can cause physiological arousal.
  • Getting an injection is a dramatic event which could be a cognitive explanation for whatever physiological arousal participants felt and could cause physiological arousal. This makes the stooge less of an influence on their emotion.
  • Epinephrine does not affect everyone in the same way.
  • Low mundane realism - It is abnormal to be randomly given an injection then asked to sit in a room with a stranger who starts acting up. Therefore this experiment may be invalid since participants may feel differently in real life. 
  • Mood was not tested before the injection - participants may have already been happy or angry before being put in the experiment.
Ethics:
  • Deception: Participants were told they were receiving suproxin to test for vision and they were told the stooge was another participant, which are all untrue. 
  • Harm: Participants were given an injection which could cause physical pain. They were also put in situations to deliberately make them happy or angry, therefore they did not leave the experiment in the same psychological state as they entered.


Friday, January 1, 2016

Psychology: Developmental psychology: Factors influencing young children's use of motives and outcomes as moral criteria

Psychology: Developmental psychology: Factors influencing young children's use of motives and outcomes as moral criteria


Author: Nelson (1980)

Key term: Children's morals

Background/context:

  • Piaget proposed that children go through 3 stages of moral development:
    -Pre-moral stage: No morals, just instinct, from birth to 4-6 years
    -Heteronomous morality: Moral is the rule, 6 - 10 years
    -Autonomous morality: Set of individual morals, 10+
  • Morality: Ability to distinguish right from wrong.
  • Piaget proposed that children under 10 based their judgement on the outcome (negative/positive) instead of intention (motives).
  • However, Nelson suggests that in Piaget's study the children did not fully understand the story, and if the child understands the story (eg. by including pictures), then they can understand motive as well as outcome.
Aim/hypothesis: To prove that children as young as 3 years do take into account both motive and outcome when making moral judgements.

Method: Field experiment in school, involving an interview.

Study 1

Variables:
Independent variables:
  1. Age: 3-4 years or 6-8 years
  2. Motive (good or bad) and outcome (good or bad)
    Stories:
    -Boy playing with ball. Wants friend to join in (good motive). Boy throws ball to friend to start game of catch. Friend catches ball and game of catch begins (good outcome).
    -Boy playing with ball. Wants friend to join in (good motive). Boy throws ball to friend to start game of catch. Ball hits friend on head and makes him cry (bad outcome).
    -Boy playing with ball. Mad at friend, throws ball to hit him on the head (bad motive). Friend catches ball and game of catch begins (good outcome).
    -Boy playing with ball. Mad at friend, throws ball to hit him on the head (bad motive). Ball hits friend on head and makes him cry (bad outcome).
  3. Mode of presentation:
    Verbal only: Stories described to each child verbally (as done by piaget).
    Motive implicit: Set of cartoon-like pictures with the positive and negative motives only implied by facial expressions.
    Motive explicit: Set of cartoon-like pictures with positive and negative motives shown explicitly by cartoon-like thought bubbles above the characters head showing his motive.
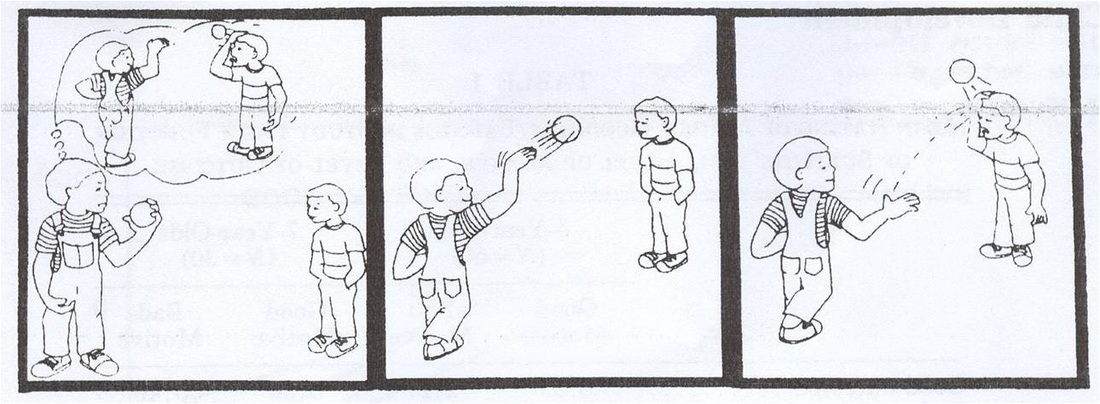
Motive explicit story board. Bad motive bad outcome story. 

Dependent variable: Judgement of whether the boy in the story was a 'good boy' or a 'bad boy' by the child. This was done by a scale of 7 faces, from a sad 'very bad' face to a happy 'very good' face. Both sets of good/bad smileys were 7.5cm (very good/bad), 6.5cm (good/bad) and 5.5cm (little bit bad/ little bit good). There was a 'neutral' 4.5cm face in the middle for 'just okay'.
PictureScale of smiley faces.

Design: Independent groups for age and mode of presentation. Motive and outcome were repeated measures because kids were shown all four stories.

Setting: Schools in and around Illinois, Chicago, USA.

Participants and sampling technique: Study 1: 60 preschool kids aged 3-4 (average age 3.4 years) and 30 kids aged 6-8 (average age 7.4 years). Half male half female. Parents gave consent for them to be in the experiment.

Apparatus: 4 stories of cartoon-like pictures. Pictures were 25 x 23 cm black and white line drawings.
  • Motive implicit: Only facial expressions
  • Motive explicit: Thought bubble showing character's intentions (motives).
  • Verbal only: Just verbal description of story.
Controls:
  • Each child had 4 stories.
  • Same experimenter tested every child.
  • Cartoons were all the same, in a standard format.
  • Children told they would have to repeat the story later so they pay close attention to the story.
Procedure:
  1. Children in each age group randomly assigned mode of presentation; verbal only, motive implicit and motive explicit. Split evenly - 20 kids in each verbal, motive implicit and motive explicit preschool group, and 10 kids in each for the older group
  2. Children were each interviewed individually by experimenter and familiarized with the rating scale (7 smiley faces) by being given 2 practice stories
  3. Children were told to listen to each story then point to which face that showed how good or bad the boy was. 
  4. After the child made their judgement, pictures were removed in the picture condition groups and child was asked to repeat the story the experimenter told. If the motive or outcome was missing, the experimenter would ask specific questions such as "Why did the boy throw the ball?". 
Data: 
  • Quantitative data: A number was allocated to each smiley face so the numbers in each IV condition could be calculated. 
  • Qualitative data: Interviewer asked child to repeat the story. A second rater was used to check interviewer understanding - great inter-rater reliability: agreement of 97%. 
Significant results:

3-4 years old:


  • Good motive: Good outcome: 6.55. Bad outcome: 4.17.
  • Bad motive: Good outcome: 2.27. Bad outcome: 1.60.
6-8 years old:
  • Good motive: Good outcome: 6.20. Bad outcome: 4.47.
  • Bad motive: Good outcome: 3.46. Bad outcome: 1.56.
Outcome: Overall good: 4.7. Overall bad: 2.92.

Age: 40% of 3-4 year olds would rate the boy as bad once any mention of 'bad' was heard, ignoring any good information. 28% ignored outcome and rated solely on motive.

Findings:
  • Outcomes greatly influenced a child's judgement as shown in overall outcome ratings - outcomes were very different from each other
  • Bad motives influence judgement much more than good motive or outcome - children learn bad before good. 
  • Only outcome judgement varied with mode of presentation, when it was expected that both motive and outcome would vary.
  • When motive was explicit, outcomes would affect the child's judgement more than verbal only or explicit. 
  • Younger children made more errors in recalling the story.
  • Less errors in motive recall when pictures were shown (motive implicit and explicit). 
  • Children want a story that is congruent (where both motive and aspects match each other - eg. all good or all bad). 
  • When a story is incongruentkids aged 3-4 have a harder time recalling the story, and tend to change the story so it is congruent.
Conclusion:
  • Young children place more importance on the valence (positive/negative or good/bad) than the motive or outcome. 
  • Children are more influenced by bad than good. This may show that children learn the concept of bad before good, as shown in the 3-4 age group.
  • However, motive might affect the child's judgement because it is the first information they receive, as results show that children immediately rate a story as bad when motive was bad. Therefore there is a design flaw, so another study was done. 

Study 2

Participants and sampling: 27 pre-school kids aged 3-4 (mean age 3.8). Each child was randomly assigned a mode of presentation.

Procedure; Everything repeated the same way as study 1 except for order of presentation: in the stories outcome was presented before motive.

Picture
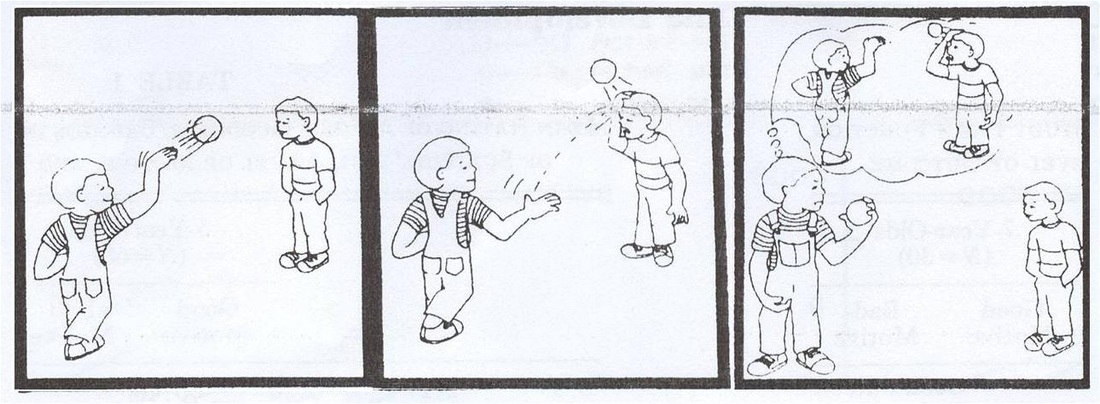
Storyboard used in Study 2. Bad motive and bad outcome story. 

Findings:
  • Same as study 1, anything negative, motive or outcome, affected judgement more than anything positive.
  • Outcome did not have a bigger affect in this study, although being presented first, which shows that motive is still taken into account and important
Conclusion:
  • Children as young as 3-4 years old can understand the concept of good and bad and if they understand the story, their moral judgment will be based on both outcome and motive
  • Mode of presentation has some effect on a child's judgement: in verbal only, children would rate the boy as bad when the mention of bad was heard, however, in picture presentations, the child understands the story more and bases judgement on both motive and outcome
  • Younger children are better at recalling the story accurately if the story is congruent (all good or all bad eg. bad motive bad outcome). 
Strengths
  • Quantitative data: Objective and easier to analyse - The data was numerical so it was easy to compare different scores in different age groups and story conditions and analyse the data collected.
    This makes it easier to draw conclusions because data can be averaged and the data is concrete and evidently supports/ doesn't support aim. 
  • Field experiment: Ecological validity - Children were in a natural setting therefore may be more likely to act naturally, therefore the experiment is valid.
Weaknesses
  • Quantitative data: Lacks valuable information - The child simply pointed at a face, but we don't know why they chose that face. We do not know the child's reasoning and whether they chose the face based on their moral judgement or because of another reason.
  • Social desirability or demand characteristics: Children might have chosen the face based on the two pilot stories they heard instead of what they believed was the answer, because the experimenter showed them what they were supposed to answer in the pilot stories.
    This would affect the validity of the data.
  • In study 1, children were told all four stories verbally. The children could have gotten bored or muddled the stories together, which would affect the judgements they made, especially for the last 2 stories. This could affect the validity of the data.
Ethics
  • Use of children - cannot give informed consent.